Hastings Wireless: Backbone Connection Line of Sight
2003 Jun 01 - Brian Kloppenborg
There are three waves of data analysis for this step. The first was a LOS (Line of Sight) analysis using USGS DEM maps. The second being satellite imagery for the path provided by a .tiff file provided by the USGS. And the third being an omni-directional analysis based upon transmitter and receiver elevation from both nodes, again using USGS DEM maps.
LOS Analysis
Using heights of 20 feet for Node 1 and 50 feet for Node 2 Global Mapper (USGS program) generated the following LOS analysis:
**Terrain Data from Node 1 to Node 2** |
**LOS Data from Node 1 to Node 2** |
Satellite Imagery
We found that along the path of our link there are a few potential problems, depending upon the site selected to install the antenna at the location of Node 1. The full high resolution .tiff image can be made available for download, if requested. The potential problem points are outlined in the image below.
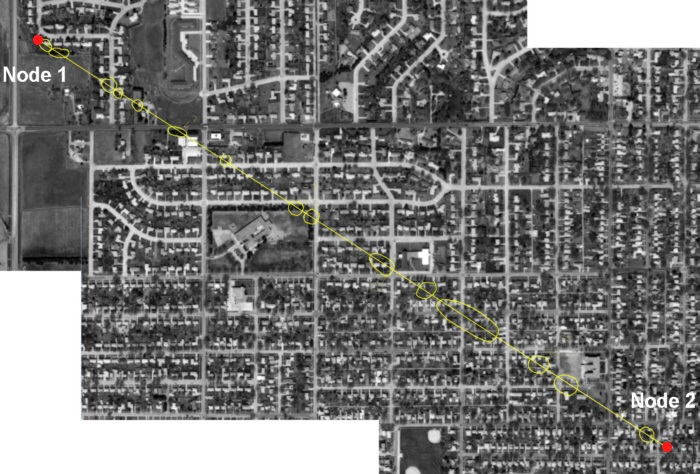
All of the problem locations indicated are trees. Hopefully a Fresnel zone can be completed around axes between Node 1 and Node 2 using either vertical polarization or horizontal polarization. From the data we collected from scouting, we believe that vertical polarization is best suited to our region and application.
Omni-directional Analysis
The final question that remains is whether or not we will be able to establish a connection using a non-directional method and if so, where can we expect to receive this signal. To do so, we again fired up the good’ ole USGS digital elevation map program and performed a View Shed analysis. The data is based upon the given heights of Node 1 and Node 2 and a receive elevation of two feet. I choose the elevation of two feet since where I would mount a receiving antenna on my car can not be much over five feet and our scouting equipment is usually placed at a height of three to four feet.
The View Shed analysis below shows the following information:
- Node 1 omni-directional view; 20 feet transmitting height, two feet reception, three mile radius: Light Green
- Node 2 omni-directional view; 50 feet transmitting height, two feet reception, three mile radius: Blue
- Node 1 and 2 overlap**: Dark Teal
- City of Hastings, Nebraska: Red denotes zoned city property
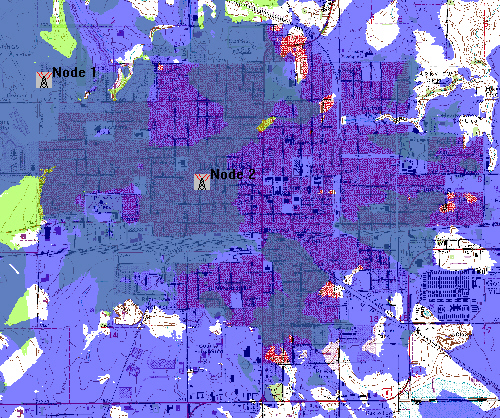
It seems that Node 1 and Node 2 have Hastings fairly well covered; however, there are some dead spots that can not be shown due to the low resolution in this image. A high resolution image in .tiff format and .jpg format including the majority of the three mile radius from Node 1 and Node 2 can be provided if requested.
Just for kicks, I decided to do a 20 mile radius county-wide omni-directional analysis, here are the results:
Node 1: Height as previously listed; reception height, 20 feet: Yellow
Node 2: Height as previously listed; reception height, 20 feet: Teal
This data does not imply that if you live in Blue Hill you will be able to receive our signal, but that if we had enough wattage (or a couple of parabolic grid antennas with humongous gain) you would be able to receive our signal.
I think sometime in the future, we should try a link using high gain directional grid antennas to Glenvil or Trumbull. There are tall structures COOP Grain elevators) which we might be able to get access to…
I should also note that the data that was used to compile this image was based upon a low-resolution USGS DEM, therefore there are likely to be many errors due to terrain elevation.
Conclusion
From the given data, we should not only be able to establish a point to point link between Node 1 and Node 2 but also provide an omni-directional link to most places in Hastings
I should also note that this information is based upon only terrain data, no information about population, buildings, flora or and other microwave frequency disruptive sources were included. Therefore the actual results may vary significantly.